

How to measure pharma batch release time from SAP-style QM tables, with SQL
Batch release lead time, right first time and where the days go, computed from process orders, goods movements, inspection lots and usage decisions. The joins, the five traps that make the numbers wrong, and a free dataset to check them on.
How to measure pharma batch release time from SAP-style QM tables, with SQL
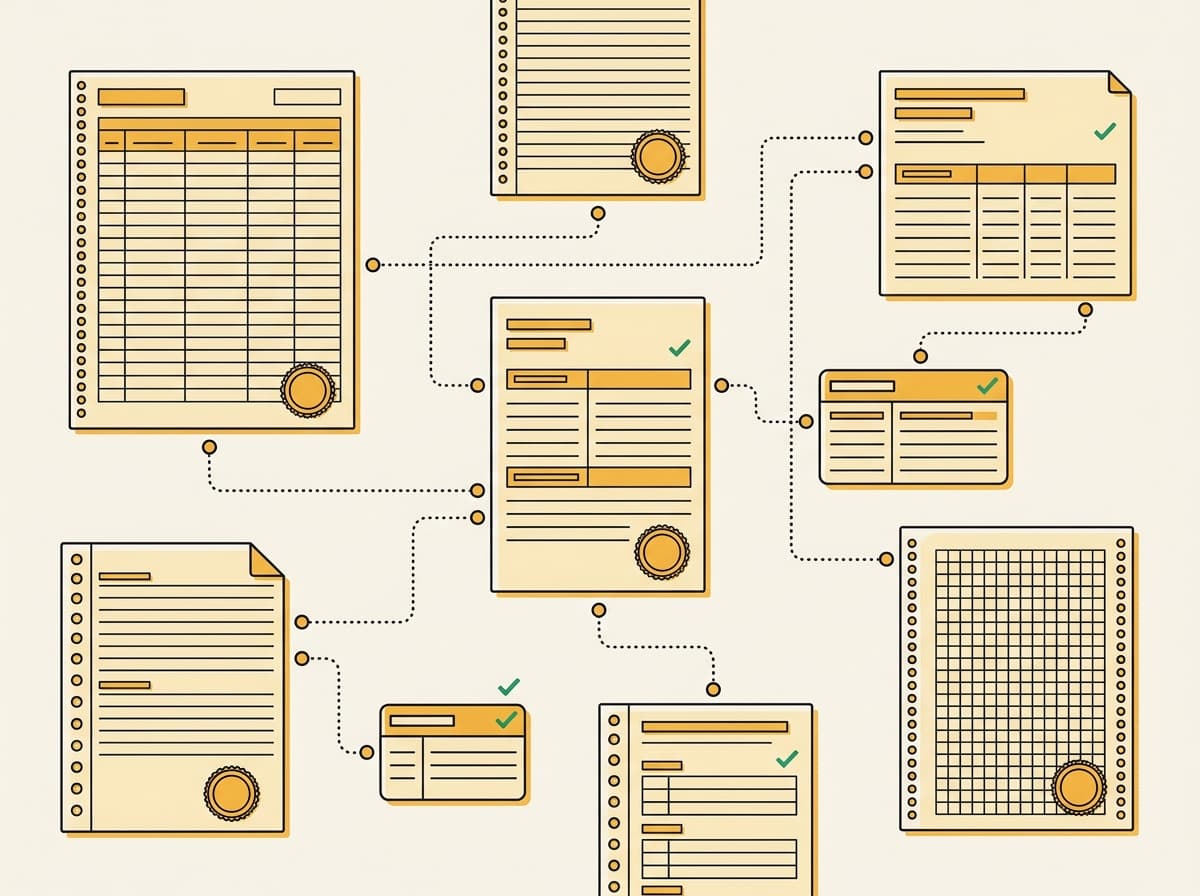
Every head of quality at a drug plant gets asked the same question: how long does it take us to release a batch, and where does the time go? The answer sits across five systems. The ERP holds the process orders, goods movements, inspection lots and usage decisions. The LIMS holds the tests, the MES holds the batch records, the eQMS holds the deviations, and the QP's register holds the certification. Each system has its own keys, its own clock and its own way of recording a mistake.
This post walks through the measurement on the SAP side: which tables, which joins, the traps that quietly make the numbers wrong, and what the answer looks like on a full two-year extract. Every query and number here was run on Batch Release World, a synthetic dataset of one oral-solids plant. Its free preview has the same tables and the same queries, so you can run everything below yourself.
The four tables behind release lead time#
The usual definition is: finished goods receipt to the usage decision on the finished batch, in calendar days. In SAP terms:
| Step | Table | How to find it |
|---|---|---|
| The packaging order | AUFK | order type AUART for packaging (here ZPI2; bulk manufacture is ZPI1) |
| Finished goods receipt | MATDOC | movement type BWART = '101' against that order, with material and batch |
| The inspection lot | QALS | inspection type ART = '04', goods receipt from production, same material and batch |
| The usage decision | QAVE | one row per lot, joined on PRUEFLOS; VCODE says release or reject |
Material plus batch (MATNR, CHARG) is the thread that ties the goods
receipt to its lot. The order number ties the receipt to the packaging order,
which is how you keep bulk receipts out.
-- SAP keeps date and time in separate fields
CREATE MACRO sap_ts(d, t) AS (d || ' ' || t)::TIMESTAMP;
CREATE MACRO days_between(a, b) AS date_diff('second', a::TIMESTAMP, b::TIMESTAMP) / 86400.0;

WITH received AS (
    SELECT m.MATNR, m.CHARG, min(sap_ts(m.CPUDT, m.CPUTM)) AS received_at
    FROM MATDOC m JOIN AUFK k ON k.AUFNR = m.AUFNR
    WHERE m.BWART = '101' AND k.AUART = 'ZPI2'
    GROUP BY ALL
),
decided AS (
    SELECT l.MATNR, l.CHARG, sap_ts(v.VDATUM, v.VEZEITERF) AS decided_at, v.VCODE
    FROM QALS l JOIN QAVE v ON v.PRUEFLOS = l.PRUEFLOS
    WHERE l.ART = '04'
)
SELECT count(*) AS batches,
       round(median(days_between(received_at, decided_at)), 1) AS median_days,
       round(quantile_cont(days_between(received_at, decided_at), 0.9), 1) AS p90_days
FROM received JOIN decided USING (MATNR, CHARG);
On the full extract this returns 1,670 batches, a median of 2.4 days and a P90 of 5.6. On the free preview it returns 77 batches, 2.2 and 5.2. The release mart that ships with the data, built separately, gives the same 2.4 and 5.6. That is the first thing to do with any KPI pipeline: compute it two ways and make the two agree.
Five traps that make the number wrong#
1. Leading zeros. Order numbers, lot numbers and batch numbers are text
(000001000620, 010000000027). Read them as integers and some joins still
work while others silently stop matching. Read every column as text and cast
only what you calculate with.
2. Date and time are separate fields. VDATUM and VEZEITERF, CPUDT
and CPUTM, ISDD and ISDZ. Use only the date and every lead time is
rounded to whole days. A batch received at 23:00 and released at 08:00 then
counts as one day instead of nine hours.
3. Cancelled confirmations. A wrong order confirmation in AFRU is not
edited. It is cancelled: the original row gets STOKZ = 'X', a cancellation
row is added with STZHL pointing at the original counter, and the correct
confirmation is entered again. In this extract 169 of 15,226 confirmations
were cancelled. Sum the yield without netting them out and 13 of 1,225 bulk
orders come out wrong, the worst at 298% of planned quantity. Netted, the
highest is 99.6%.
CREATE VIEW afru_net AS
SELECT * FROM AFRU WHERE STOKZ IS NULL AND STZHL IS NULL;
4. Goods-issue reversals. The same applies to MATDOC: a component
issued to the wrong order (movement 261) is reversed with a 262. There are 97
reversals here. Count consumption or build a batch genealogy without netting
them and a finished batch appears to contain an API lot it never touched.
5. "Right first time" has no single definition. Some plants count a batch as right first time if it was released at all. Others require no deviation, or no rework of the batch record. Say which you use. Here it is strict: the batch was released, with no deviation and no OOS investigation on it or on its bulk batch, and both batch records (bulk and packaging) were approved at the first QA review. On that definition 45.7% of finished batches are right first time. Loosen it to "released" and it becomes 99.2%, which tells you nothing.
Where the time actually goes#
Release lead time measures the last mile. The whole journey, from the start of bulk manufacture to release, takes a median of 20.6 days. The release mart splits it into stages (decided batches, days):
| Stage | Median | P90 |
|---|---|---|
| Bulk order created to manufacture start | 12.8 | 15.2 |
| Manufacture start to bulk goods receipt | 2.5 | 4.7 |
| Bulk goods receipt to bulk usage decision | 4.9 | 10.0 |
| Bulk usage decision to packaging start | 9.3 | 13.7 |
| Packaging start to finished goods receipt | 0.3 | 0.4 |
| Finished goods receipt to packaging record approved | 1.5 | 4.4 |
| Packaging record approved to QP certification | 0.2 | 2.8 |
The first and fourth rows are planning, not quality. The planner turns each Thursday's plan for the week after next into process orders, so an order exists about two weeks before it starts. Packaging is slotted about eight days after bulk manufacture ends, to leave room for QC; bulk that passes early waits for its slot. The stages quality controls are bulk testing (4.9 days, with a long tail) and record review. A team that tracks only release lead time sees 2.4 days and misses the nine-day wait between bulk release and packaging.
The calendar matters too. A pack finished on a Thursday or Friday waits for the weekend: a median of 4.0 days to release, against 1.8 for one finished Monday to Wednesday. A product packed late in the week looks slow on a dashboard for reasons that have nothing to do with the product.
Process mining: one case per batch, or objects#
For process mining, the flat event log has one case per finished batch, with every event on its orders, inspection lots, tests, batch records and deviations, and on its bulk batch. Grouping cases by the exceptions they met gives the variants that matter:
| Exceptions on the way | Batches | Median days, bulk start to release |
|---|---|---|
| none | 627 | 20.1 |
| batch record returned by QA | 401 | 20.8 |
| deviation | 175 | 24.7 |
| deviation and record returned | 148 | 23.4 |
| deviation, record returned and goods issue reversed | 14 | 30.3 |
Batches whose record QA returned took 0.7 days longer than batches with no exception; batches with a deviation took 4.6 days longer. The variants overlap (a batch can meet several), so read these as associations, not as the cost of each event alone.
The flat log has a known flaw: one bulk batch is packed into several finished batches, so its events appear in each of their cases (convergence), and a deviation on that bulk is counted several times. An object-centric log avoids this. The same events are in an OCEL 2.0 file, with 9 object types (orders, batches, inspection lots, tests, batch records, deviations and more) and each event linked to every object it touched, and in XES for tools that want one case notion.
Checking an analysis instead of arguing about it#
The hard part of building any of this on real data is that nobody knows the right answer. A dashboard says assay testing slowed down in March; is that real, or a join that drops retests? With real extracts you cannot tell.
Batch Release World is generated by simulating the plant event by event: each batch waits for the analyst, instrument or reviewer it needs, and each result follows from what was done to that batch. Seven things went wrong over the two years, among them two of the four release HPLCs broken at once, a QA reviewer on leave, a worn press, and one analyst reintegrating chromatograms far more than anyone else. Each is recorded only the way a real plant would record it. The answer key in the full download says what happened, when, and the query that finds it, with the numbers it returns, so a pipeline, a dashboard or an AI assistant can be checked against a known truth.
- Free preview (CC BY 4.0): every table, a sample of batches, the data dictionary, the queries and the audit script. Download it from the dataset page.
- Full dataset ($49, personal licence for one named person): 661,497 rows in 65 tables, the OCEL 2.0 and XES logs, and the answer key. Team and client use is under a commercial licence on request.
SAP is a trademark of SAP SE. The tables use SAP's table and field names so the data looks like an SAP extract; Misata is not affiliated with SAP SE or endorsed by it. The data is synthetic and not validated for GxP use.
Written by Muhammed Rasin
Founder and lead architect at Misata. Obsessed with relational integrity, deterministic simulation algorithms, and mathematical test data guarantees for mission-critical software.